(Author's note: this page is a bit of a show-off page. The Mandelbrot Set and the graphing thereof is what has drawn me to learning about fractals and developing ways to graph them myself. Hence, this page will be a little bit of a gallery of some of the more choice creations I've completed.)
In addition to understand recursion, one must have a passing understanding of imaginary numbers. Such things make no reasonable sense but can and are extensively used in mathematics. An imaginary number is quite simply the square root of negative one, typically referred to as i. Given that any real number multiplied by itself is always positive or zero, it's clear that in math as most understand it that there is no number than can be squared to get -1. Hence, i is the basic imaginary number. Of course, multiplying this times anything else leads to an infinite amount of imaginary numbers, 7i, -28i, 0.1i, whatever you like.
Further, i can be treated as any other number, and behaves in a cyclic fashion. The square of i is -1, the cube of i is -i, and raising i to the 4th power is 1. Then the cycle repeats if we multiply it by itself five times, then six, etc.
We can then combine this weird concept with a normal, real number, to create what are known as complex numbers, which are expressed as a real number plus a real number times an imaginary number. For example, 1 + 2i is a complex number. Also, all normal numbers are contained within complex numbers, for example 1 can be written as 1 + 0i.
Now, anything that we know how to do on normal numbers can be done on complex numbers. We can add complex numbers, we can divide them, whatever we like. So now we arrive where the fun begins.
Let us take a plane in which the horizontal axis is all real numbers and the vertical axis is all imaginary numbers. Clearly, any point we choose on this plane is a complex number, the real part from the horizontal axis and the imaginary part from the vertical axis. That is, if we take 2 from the horizontal and 4 from the vertical, we get the complex number 2 + 4i.
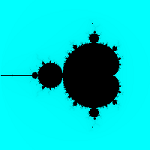
 Benoit Mandelbrot was not the first to describe the process we are about to discuss, but he worked with it the most and the pictures we see here are associated with his name. The process is to take a point on the complex plane described in the last paragraph, an initial value of 0 (or, 0 + 0i), multiply it by itself, add our chosen point, then take that result and use it as our initial value and do it again. Then again. And so on, we recurs the results through the function again and again. One of two things will happen, the magnitude of this complex number will either diverge or escape, that is, become infinitely large, or it won't. We take the result and paint the point we chose according to a coloring scheme previously decided. Typically, the points that don't diverge are colored black, the points that do are given something else. The example to our right is this simple graphing, black is not divergent and teal is.
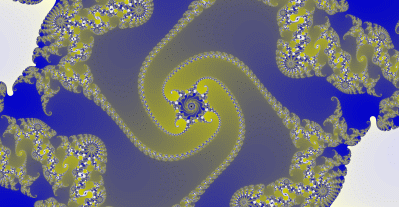
 Here is where the magic comes in, the artistry. These graphs are not simple two-dimensional shapes, but the rate at which the escaping points are all different. We can then color the rates at which they are escaping as per a predetermined color palette and get exciting patterns, such as the image in our header, or the colors can change according to algorithms we design into our graphing program, again creating engaging and exciting images, such as the example on our left (click to enlarge).
The image in the header of this page is a close up of a Mandelbrot Set, using walnut for quickly diverging points and creme for slowly diverging points. Because something so fantastic could come from what we will soon see is so simple and with such simple color choices, there was no other choice but to use walnut and creme for the style of these pages. It should be noted that deep within that image, at the center, is a region of non-escaping points that are the same shape as the original Mandelbrot Set. This is another thing that is exciting about these graphs, is that we can compose frames and change the parameters over and over and compose these framesets into animations of zooms into the graph, deeper and deeper, the only limitation being the power of our computers.
We'll close this with some links to choice zooms, color palette rotations, and still images. Some of these are quite large, file sizes are given for these.
Der Schnee (The Snow), 58MBs, a zoom
In The Back, 38MBs, a zoom
Spinnie, 44MBs, colors rotated through the rainbow (ROYGBIV)
Stills
Neato, 18MBs, a 7'x7' version of the top image
Elephants and Monsters
Uzumaki (Spirals), 1.5MBs
Nebula
Here is more information, at a much higher level of discussion, at Wikipedia.
