There are two ways to approach this topic. One is to be mathematical and rigorous, discussing the concepts in the exacting language of math. Another is to look at the interesting, engaging, and often pretty pictures of fractals and discuss what's happening inside without being pedantic about the process.
We shall take the latter approach. Links will be provided to the former, if one is interested to study further.
Fractal imagery is a graph of a mathematical function. However, the processes of generating these graphs are approachable enough because of their simplicity. Often, once people begin to learn what is happening inside the picture, a new level of appreciation is gained without the loss of aesthetic enjoyment.
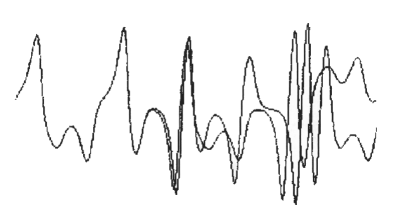
These graphs are based upon non-linear dynamics, also known as chaos theory. The origin of this branch of math is from meteorology. In the 1950s and 60s, the goal of meteorology was weather control, not simply projection. One meteorologist, Edward Lorenz, created a computer model of a planet in which one entire hemisphere was water and the other land, using ten equations and ten variables to model the weather. The expectation was that such computer models would allow direct prediction of what we do to the world yields what pattern of weather. He printed a graph and the values of the variables of one pattern. However, his print out was of less digits than the computer used internally. Later, wanting to study it more, he reentered the numbers into the program and got wildly different weather after about five model days. The two graphs together are found in the header of this page. This led to some conclusions:
- The Butterfly Effect. Indeed, the picture in the header is the original Butterfly Effect. He determined that small variations can lead to wild variation later.
- Chaos theory. As he continued to study this phenomenon, and to counter his critics who wanted to dismiss his work, he ended up becoming the father of non-linear dynamics as a math.
- The end of hopes to control weather.
(By the way, this is also why weather forecasts tend to be five-day forecasts.)
The other basic concept to understand is the term 'fractal'. It is a shortening of 'fractional geometry'. Normally, we think of dimensions in whole numbers. A point has zero dimensions, a line is a one dimensional object, a surface is two dimensional, and we live in three dimensional space. Are there things that have fractional dimensions? Yes, there are, and there are many. The Koch Curve, which is discussed on its own page, has a dimension of approximately 1.26. It's not a line, but it's not a surface, it's somewhere in between. While chaos is a relatively new field of study, the concept of a fractal is much older, the late 1700s, first described by Gottfried von Leibniz.
Clearly a quick and dirty coverage of the subject, this information should be sufficient to move on to the specific sub-pages that follow. While there is no specific order, Recursion is the recommended next page to study, for that concept is basic to the entire process of creating fractals. Before we leave this page, though, let us look at a brief run-down of the kinds of fractals most commonly seen. Each example is clickable for better viewing.
| Cantor Dust |  |
 |
Koch Snowflake |
| Mandelbrot Set |  |
 |
Julia Set |
| IFS Maple Leaf |  |
 |
Lyapunov Set |
